Orginal Article

Relationship of Ecological Well-being Performance and Sustainable Economic Development in Liaoning Province

  • ZHANG Hua ,
  • YU Miao ,
  • SUN Cuiyang ,
  • LIU Jiangang , *
Expand
  • School of Urban and Environmental, Liaoning Normal University, Dalian, Liaoning 116029, China
*Corresponding author: LIU Jiangang, E-mail:

Received date: 2018-07-21

  Accepted date: 2018-09-30

  Online published: 2019-01-28

Supported by

Natioanl Natural Science Foundation of China (41271064)

Educational Committee Foundation of Liaoning (L201783640)

PhD Research Startup Foundation of Liaoning University (BS2018L014)

Copyright

All rights reserved

Abstract

Liaoning Province is in a critical period of economic transformation. The rational utilization of ecological resources and the balance of the relationship between the resource environment and economic growth have become the key factors affecting its sustainable economic development. This paper uses data from the Human Development Index and an ecological footprint to construct the ecological well-being performance of Liaoning Province from 2006 to 2016. It then examines the relationship of ecological well-being performance with economic growth, considers the factors influencing the well-being level effect, and analyzes the trends for sustainable economic development from the perspective of ecological well-being. There is a horizontal comparison of the current situation of ecological well-being performance in Liaoning Province and with other coastal provinces in China and clarification of the stage and development gap. The conclusions show that: 1) The trend of ecological well-being performance in Liaoning Province during this period first decreased and then rose, with this movement mainly affected by changes in the ecological footprint; 2) There is a U-shaped relationship between ecological well-being performance and economic growth, and resource consumption contributes less to promote well-being; 3) There are three stages to the sustainable development trend: inferior, medium and advanced. When compared with others coastal provinces, Liaoning Province belongs to the high consumption and low well-being type.

Cite this article

ZHANG Hua , YU Miao , SUN Cuiyang , LIU Jiangang . Relationship of Ecological Well-being Performance and Sustainable Economic Development in Liaoning Province[J]. Journal of Resources and Ecology, 2019 , 10(1) : 39 -47 . DOI: 10.5814/j.issn.1674-764X.2019.01.005

1 Introduction

Economic growth has always been regarded as a necessary condition to enhance human well-being, and the quality of the ecological environment determines the sustainability of economic growth. In traditional economics, the development of the economy is focused on economic efficiency, and the economy needs to continuously consume natural capital to achieve the goal of development. After the first industrial revolution, natural capital was relatively abundant for a time. It is rational that natural capital and artificial capital are mutually replaceable (Daly, 2005). However, in a fast- growing economy, the scarcity and irreplaceability of critical natural capital (CNC) becomes an increasingly outstanding problem, and the ecological environment gradually becomes a factor constraining the development of the economy. The notion that “lucid waters and lush mountains are invaluable assets” serves to confirm the dialectical relationship between economic development and ecological protection. The green economy is key to sustainable development and it has been vigorously promoted, making it an indispensable part of current models for economic development. Ecological well-being performance provides evidence that can be used to measure the development of the green economy. It is obtained by determining the ratio of social well-being value to ecological resource consumption; this ratio measures the efficiency of well-being generated by the per unit consumption of ecological resources.
American ecological economist Herman E. Daly (1974) defined the meaning of ecological well-being performance: it refers to the growth of well-being brought about by the consumption on a per unit basis of ecological resources. Rees (1992), an American ecologist, proposed the concept of “ecological footprint”, which is a tool to quantify the degree of resource consumption and environmental impact. He allows ecological well-being performance to extend to empirical research. Foreign scholars often use common proportion algorithms (the ratio of social well-being level to ecological resource consumption) to measure ecological well- being performance (Yew, 2008), or use other methods to construct ecological well-being performance indicators, such as stochastic frontier function (Dietz et al., 2009) or non- standardized residual in the regression equation (Knight and Rosa, 2011). In qualitative research, some scholars have discussed in detail the meaning and selection of the indicators, and hold that measures of the level of human well-being should not only include objective well-being indicators, but also be affected by subjective well-being feelings (Knight, 2014; Veenhoven, 2002). Most quantitative studies are concerned with analyses of ecological well-being performance and economic growth (Jorgenson, 2014; Rice, 2008).
Research on ecological well-being performance in China began relatively late, and has focused mainly on the following aspects: 1) Studies of the theoretical basis, concept connotation and index construction of ecological well-being performance (Zhu et al., 2014, Zang et al., 2013 and Zhang et al., 2014). A G20 state is used as an example to analyze the decoupling relationship between the well-being of that state and ecological resource consumption, and then the strategic choice of improving ecological well-being performance and realizing economic sustainable growth is put forward; 2) The level of the sustainable economic development in a region is evaluated by measuring ecological well-being performance. He et al. (2011) and Chen (2012) calculate the ecological well-being index of Shaanxi Province for a period of nearly 20 years and propose suggestions for development based on the economic, social and ecological characteristics of the province. Zhang et al. (2016) measure the conversion efficiency of natural consumption and well-being levels in the eastern, central and western regions of China and estimate the situation for sustainable economic development. 3) The factors influencing ecological well-being performance are analyzed. Long et al. (2016) selected the Super-SBM model considering the slack variable to measure the ecological well-being performance of 35 large and medium-sized cities in the eastern, central and western China, construct a Tobit regression model to analyze the factors influencing well-being performance, and evaluate the urban development efficiency of Shanghai using the DEA method. Feng et al. (2016) use the Logarithmic Mean Divisia Index to analyze the ecological well-being performance and the factors impacting this performance in 30 provinces and cities in China from the perspective of service effects and technical effects. 4) Studies of the significance of ecological well-being performance to human and social development. Fan (2009) examines the idea of ecological well-being and its positive effects on social and human development from the perspective of social policy. Deng et al. (2014) and Liu et al. (2013) analyze the necessity of constructing ecological well-being systems and put forward some suggestions from a social perspective.
Most studies compare the ecological well-being performance of different countries or regions horizontally, while they lack a multi-angle vertical analysis of ecological well- being performance of a certain region, and cannot explain the relationship of well-being performance to social, economic and environmental factors. Therefore, based on the perspective of ecological well-being, this study analyzed in detail the relationship between ecological well-being performance and sustainable economic development in Liaoning Province. The study examined the effects of changes in the ecological well-being level of the province and the trend of sustainable economic development, and analyzed the current situation of ecological well-being performance by comparing Liaoning Province with other coastal provinces in China. The study provides information of great significance to the economic transformation and development of Liaoning Province in the future.

2 Data sources and research methods

Different methods are used to evaluate ecological well- being performance. Most scholars use the ratio of the human development index to the ecological footprint index. The human development index represents the level of well-being obtained by human beings. The ecological footprint index measures a person, or a region or a country demand on nature. In another words, it measures the accommodating human waste emissions capability (Huang et al. 2016; Lu et al. 2016). Both of these indexes can quantitatively measure ecological well-being performance, and they were the evaluation methods adopted in this study. Other scholars have used a variety of methods like data envelopment analysis, stochastic frontier production function, regression equations and other methods to calculate ecological well- being performance (Qi et al. 2017).

2.1 Data sources

The data used in this paper were taken from statistical yearbooks for the years 2007 to 2017, including the China Statistical Yearbook, Liaoning Statistical Yearbook, Liaoning Education Statistical Bulletin, China Agricultural Statistical Yearbook, China Rural Statistical Yearbook, and China Energy Statistical Yearbook. Food and Agriculture Organization of the United Nations (FAO) data were also used. Interpolations and extrapolations were used to fill in missing data.

2.2 Research methods

2.2.1 Indicator systems
The United Nations Development Programme (UNDP) divides the assessment of the human development index (HDI) into three dimensions: economy, education, and health. These are measured in terms of indicators for per capita national income, years of education and life expectancy (Zhang and Shi et al., 2017; Li et al., 2017) (Table 1). Ecological footprint (EF) measures the carrying capacity of ecosystems for human activities to quantify the geographical area of biological productivity. Based on the actual situation of Liaoning Province, this study selected biological resource consumption and energy consumption to measure the carrying capacity of the ecological footprint. Unlike other Chinese studies, this paper also took into account the impact of imports and exports (Fu et al. 2014). See Table 1.
Table 1 Evaluation system of ecological well-being performance index
Category Primary index Secondary index Tertiary index
Human development index (HDI) Economy Per capita income index Per capita national income
Education Education development index Average school education years
Expected school education years
Health Life expectancy index Life expectancy of the birth population
Ecological footprint
(EF)
Biological resource
consumption
Cultivated land Rice, wheat, corn, soybean, oils, beet, vegetable,
cotton, tobacco
Grassland Meat, milk, eggs
Woodland Timber, fruit
Water area Aquatic product
Energy consumption Energy land Raw coal, crude oil, natural gas
Construction land Hydroelectric power
2.2.2 Measurement of ecological well-being performance
Ecological well-being performance (EP) is the ratio of HDI to EF:
\[EP=\frac{HDI}{EF}\ (1)\]
The HDI formula was obtained from the Human Development Report 2016 issued by the UNDP and consists of the per capita income index (II), the education development index (EI) and the life expectancy index (LEI):
\[HDI=\sqrt[3]{II\times EI\times LEI}\ (2)\]
Where II is per capita income index:
II=[lg(GNIpc) ‒2.21]/2.82; (GNIpc represents per capita national income); EI is the education development index: \[EI=MYS/15.68\] (MYS represents mean years of school education); LEI is the life expectancy index: LEI=(LE‒20)/ 63.2 (LE represents life expectancy).
These 19 representative indexes (Table 1) explain that in order to come up to a certain of well-being level, how many areas of ecological footprint had been consumed. And this formula can figure out production area both in biological resource consumption and energy consumption of above six types of land. To convert biological resource consumption \({{A}_{i-b}}\) and energy consumption \({{A}_{i-e}}\) into the production area of the above six types of land.
\[EF=\sum{{{r}_{i}}\times {{A}_{i-b}}+\sum{{{r}_{i}}\times {{A}_{i-e}}}}\ (3)\]
Where \({{A}_{i-b}}=\left( {{P}_{i}}+{{L}_{i}}-{{E}_{i}} \right)/({{Y}_{i}}\times N)\);\({{A}_{i-e}}=\frac{{{P}_{i}}\times 7000\times 4.1868}{{{Y}_{i}}\times {{10}
{6}}\times N}\); \({{r}_{i}}\) are the equilibrium factors. Because the production capacity of different land types varies, an equivalence factor ri was introduced (cultivated land and construction land were 2.8; forest and fossil energy land were 1.1; grassland was 0.5; ocean was 0.2) to differentiate between land types (Wackernagel et al., 1994; Liu et al., 2009); Pi is annual production of i species consumption item, Li is annual import volume of i species consumption item, Ei is annual export volume of i species consumption item, Yi is annual (World) average production of i species of biological production land, N is Population. (1 t raw coal = 0.7143 t standard coal, 1 t crude oil = 1.4286 t standard coal, 1 m3 natural gas = 1.33 kg standard coal, 1 kWh electric power = 0.1229 kg standard coal, 1 kg standard coal thermal energy = 7000 kcal; These data were derived from the Energy Statistics Report System for Key Industries and Transportation Enterprises in 1986 , published by the State Economic and Trade Commission and the National Bureau of Statistics)
2.2.3 Model to correlate ecological well-being performance and economic growth
The Environmental Kuznets Curve indicated that there was an inverted U-shaped relationship between environmental pollution and per capita income, which means that the degree of environmental pollution increased at the beginning and then decreased with the growth of per capita income (Fan et al., 2016). Based on the Kuznets Curve, it can be inferred that in the early stage of economic development,the over consumption of natural resources in a region, resulting that the EP generated by economic growth gradually diminishes over time. And the EP generated by economic growth gradually diminishes over time. When economic growth reaches a certain level, good economic conditions allow for the establishment of a biological compensation mechanism; if ecological resources are organized rationally and the environment improves, EP will also rise. Therefore, this study assumes that the EP and economic growth of Liaoning Province were U-shaped. Economic growth was represented by per capita GDP (GDPpc), and the natural logarithm form was used to establish the function model as follows:
\[\begin{align} & \ln EP=\alpha \times {{\left( \ln GD{{P}_{pc}} \right)}
{n}}+\beta \times {{\left( \ln GD{{P}_{pc}} \right)}
{n-1}}+\cdots + \\ & \ \ \ \ \eta \times \ln GD{{P}_{pc}}+C+\varepsilon \\ \end{align}\ (4)\]
Where \(\alpha \), \(\beta \), ..., \(\eta \) were independent variable coefficients, \(C\) was a constant term, and \(\varepsilon \) was random error term. Origin 8.5 was used to complete the regression analysis for the model.
2.2.4 Logarithmic Mean Divisia Index
Logarithmic Mean Divisia Index (LMDI) is a calculation method for quantitative decomposition of influencing factors, and is often used in analyses of water resources or energy efficiency. This method analyzes the principal factors that affect the research object without residuals (Ang 2004; 2005). From the perspective of economics, this study chose LMDI to decompose HDI into the natural resources effect, the economic effect produced by the consumption of one unit of ecological resources and the well-being level effect generated by a unit of economic development. The whole effect of the ecological well-being level amounted to the sum of the differences in ecological well-being levels of the three effects from the base year to t year (Zhu et al., 2014):
\(HDI=E{{F}
{*}}\times \frac{GDP_{pc}
{*}}{E{{F}
{*}}}\times \frac{HDI}{GDP_{pc}
{*}}=E{{F}
{*}}\times I\times P\ (5)\)
Where HDI was a dimensionless value between 0-1, so GDPpc and EF needed to be dimensionless; \(GDP_{pc}
{*}\) and EF* represent resource effects, I represents economic effect, and P represents well-being effect.
The difference in ecological well-being level between the base year (t0) and t year represents the overall effect of ecological well-being (WPE):
\[WPE=WP{{E}_{t}}-WP{{E}_{{{t}_{0}}}}=EF_{\Delta }
{* }+{{I}_{\Delta }}+{{P}_{\Delta }}\ (6)\]
Where \(EF_{\Delta }
{* }=\frac{WP{{E}_{t}}-WP{{E}_{{{t}_{0}}}}}{\ln \left( WP{{E}_{t}} \right)-\ln (WP{{E}_{{{t}_{0}}}})}\times \ln \left( \frac{EF_{t}
{* }}{EF_{{{t}_{0}}}
{* }} \right)\) and represents the resource effect of ecological resources change; where \({{I}_{\Delta }}=\frac{WP{{E}_{t}}-WP{{E}_{{{t}_{0}}}}}{\ln \left( WP{{E}_{t}} \right)-\ln (WP{{E}_{{{t}_{0}}}})}\times \ln \left( \frac{{{I}_{t}}}{{{I}_{{{t}_{0}}}}} \right)\) and represents the economic effect of economic development; where \({{P}_{\Delta }}=\frac{WP{{E}_{t}}-WP{{E}_{{{t}_{0}}}}}{\ln \left( WP{{E}_{t}} \right)-\ln (WP{{E}_{{{t}_{0}}}})}\times \ln \left( \frac{{{P}_{t}}}{{{P}_{{{t}_{0}}}}} \right)\) and represents the well- being effect of the change in well-being level.
2.2.5 Trend model of sustainable economic development based on ecological well-being
EP represented the relationship between the input of the social-economic-environmental composite system and the output of human well-being. If the index value of EP increases with time, it indicates that the economic development of this area has good sustainability, whereas a decreasing EP indicates poor sustainability. The models are:
\[EP({{t}_{0}})< EP({{t}_{0}}+\Delta t)\ (positive sustainability)(7)\]
\[EP({{t}_{0}})> EP({{t}_{0}}+\Delta t)\ (negative sustainability) (8)\]
Considering the change of the developmental path of ecological well-being performance, a two-dimensional relationship diagram showing the change rate of the human development index \(\Delta HDI\) and the change rate of the ecological footprint index \(\Delta EF\) was constructed (Fig. 1).
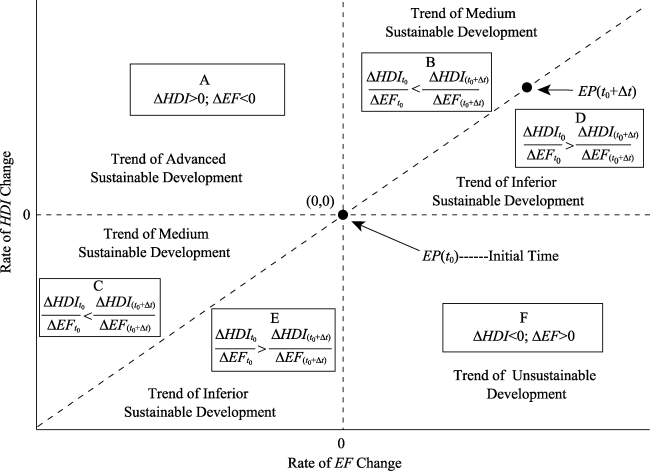
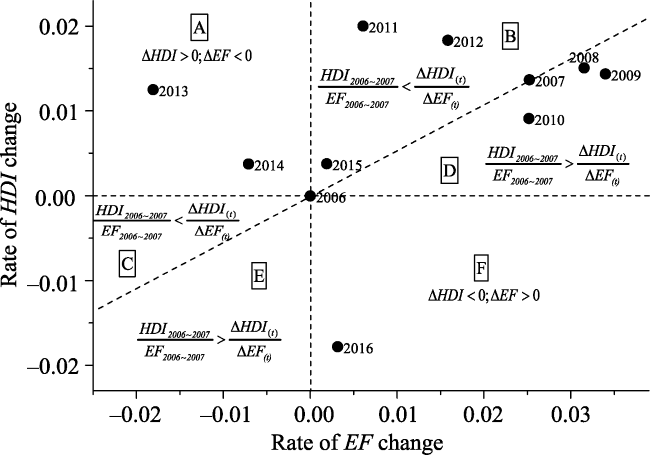
Fig. 1 The schematic diagram of rate of sustainable development change
The development and change of ecological well-being performance were divided into six types of sustainable development trends, among which A type was an advanced sustainable development trend, B and C types were medium sustainable development trends, D and E types were inferior sustainable development trends, and F type was an unsustainable development trend. The signification and characteristics of the trends are shown in Table 2.
Table 2 The types of sustainable development trends
Trend types Expression of change rate Signification Trend of sustainable development
A HDI > 0; ∆EF < 0 An increase in human well-being level combined with a decrease of ecological resource consumption is a high sustainable development trend. Advanced sustainable development
B HDI > 0; ∆EF > 0;
\(\frac{\Delta HD{{I}_{{{t}_{0}}}}}{\Delta E{{F}_{{{t}_{0}}}}}<\frac{\Delta HD{{I}_{({{t}_{0}}+\Delta t)}}}{\Delta E{{F}_{\text{(}{{t}_{\text{0}}}+\Delta t\text{)}}}}\)
The human well-being level is rising, and the ecological resource consumption is increasing. However, compared with the initial time (2005), at this time, the ecological well-being performance is growing faster, and this is a medium sustainable development trend. Medium sustainable development
C HDI < 0; ∆EF< 0;
\(\frac{\Delta HD{{I}_{{{t}_{0}}}}}{\Delta E{{F}_{{{t}_{0}}}}}<\frac{\Delta HD{{I}_{({{t}_{0}}+\Delta t)}}}{\Delta E{{F}_{\text{(}{{t}_{\text{0}}}+\Delta t\text{)}}}}\)
The human well-being level is decreasing, and the ecological resource consumption is also decreasing. However, compared with the initial time (2005), at this time, the ecological well-being performance is growing slower, and this is a medium sustainable development trend.
D HDI > 0; ∆EF > 0;
\(\frac{\Delta HD{{I}_{{{t}_{0}}}}}{\Delta E{{F}_{{{t}_{0}}}}}>\frac{\Delta HD{{I}_{({{t}_{0}}+\Delta t)}}}{\Delta E{{F}_{\text{(}{{t}_{\text{0}}}+\Delta t\text{)}}}}\)
The human well-being level is rising, and the ecological resource consumption is increasing. However, compared with the initial time (2005), at this time, the ecological well-being performance is growing slower, and this is an inferior sustainable development trend. Inferior sustainable development
E HDI < 0; ∆EF< 0;
\(\frac{\Delta HD{{I}_{{{t}_{0}}}}}{\Delta E{{F}_{{{t}_{0}}}}}>\frac{\Delta HD{{I}_{({{t}_{0}}+\Delta t)}}}{\Delta E{{F}_{\text{(}{{t}_{\text{0}}}+\Delta t\text{)}}}}\)
The human well-being level is decreasing, and the ecological resource consumption is decreasing. However, compared with the initial time (2005), at this time, the ecological well-being performance is growing faster., and this is an inferior sustainable development trend.
F HDI<0; ∆EF>0 The decrease of human well-being level and the increase of ecological resource consumption show an unsustainable development trend. Unsustainable development

3 Results analysis

3.1 Analysis of the development of and changes to ecological well-being performance in Liaoning Province

During the years 2006 to 2016, EP in Liaoning Province first decreased and then increased with a fluctuation range of 0.93-0.99 (Fig. 2). The highest value was 0.9905 in 2006, after which there was a downward trend for four consecutive years, with the value decreasing to 0.9306 in 2010; there was an average annual decline of 2.06 percentage points. The growth rate of the ecological footprint index was higher than that of the human development index. At this stage, improvement in the level of human well-being in Liaoning Province was at the expense of ecological resource consumption, with environmental pollution problems caused by heavy industry production inhibiting the sustainable economic development of Liaoning Province to a great extent. After this time, a new approach to industrialization was implemented in Liaoning Province. The industrial structure of the province was steadily optimized and upgraded, and the government’s emphasis on efficiency and sustainable utilization of ecological resources got results. The level of human well-being gradually rose, while the EF index began to decline and tended to stabilize, resulting in the rise of EP. Liaoning Province worked step-by-step to eliminate the model of economic development based on high energy consumption and causing high pollution levels, moving towards an environmentally friendly, sustainable development model focused on resource-saving.
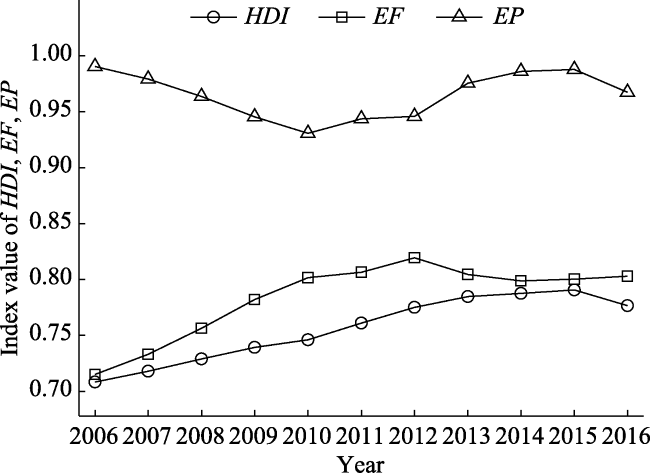
Fig. 2 Tendencies and factors of EP change in Liaoning Province from 2006 to 2016

3.2 Analysis of the correlation between ecological well-being performance and economic development in Liaoning Province

3.2.1 Analysis of the correlation between ecological well- being performance and economic growth
Origin regression analysis was used to analyze the model of ecological well-being performance and economic growth in Liaoning Province from 2006 to 2016, and the relationship between the two was found to conform basically to the assumed cubic function model. The Goodness of Fit was R2=0.79, overall test F of the regression equation was 46.87, and Prob>F was 5.31E-5, so the model passed the reliability the test. Based on formula (4), its function expression is as follows:
\[\begin{align} & \ln EP=502.18-128.00\ln GD{{P}_{pc}}+ \\ & \ \ \ \ 10.86{{\left( \ln GD{{P}_{pc}} \right)}^{2}}-0.31\times {{\left( \ln GD{{P}_{pc}} \right)}^{3}}. \\ \end{align}\]
The ecological well-being performance of Liaoning Province from 2006 to 2016 showed a U-shaped curve for its GNPpc (Fig. 3). On account of the development of heavy industry over a long period of time, the resources of Liaoning Province were gradually depleted and the environment was severely degraded. The province’s ecological well- being performance decreased with economic growth year by year, and in 2010 ecological well-being performance hit its the lowest point (0.9306). At the same time, GNPpc was CNY 84118.60. After 2010, as per capita income increased, accelerated economic development is benefit for environment protection. During the 11th Five-Year Plan period (2006-2010), key environmental protection projects were formulated, there was increased investment in industrial pollution treatment, a comprehensive effort was made to govern urban environmental problems, and efforts to supervise resource utilization were strengthened. These measures led to a rise in ecological well-being performance that accompanied economic growth.
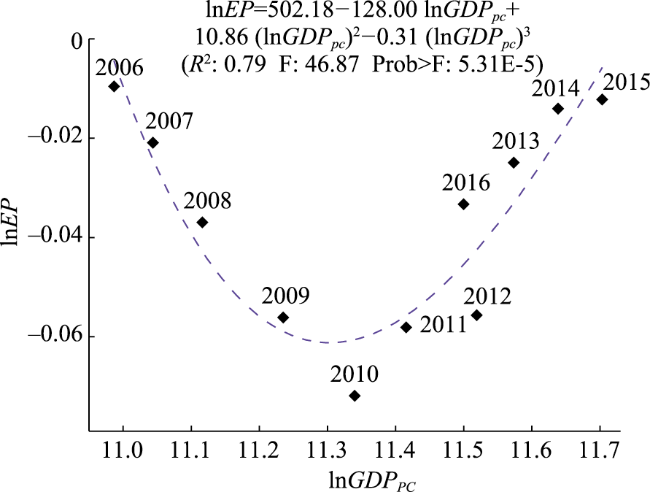
Fig. 3 The model of ecological well-being performance and economic growth in Liaoning Province from 2006 to 2016
3.2.2 Analysis of the effects of the ecological well-being level
The overall effect of ecological well-being was decomposed into factors using the LMDI. The relationship between the WPE and ecological resources consumption, economic development and the well-being level in Liaoning Province from 2006 to 2016 were analyzed, as shown in Fig. 4.
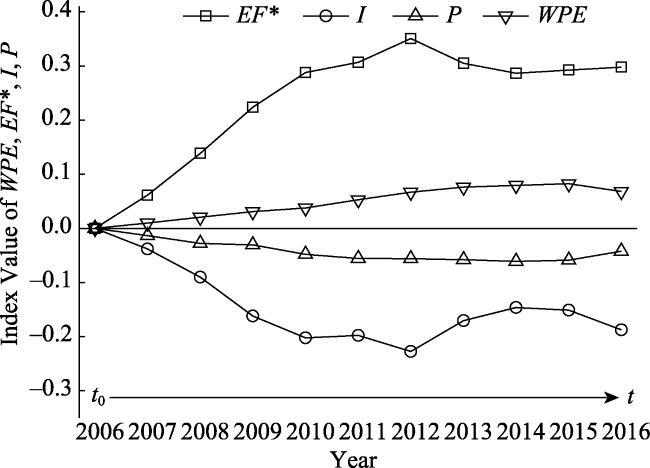
Fig. 4 Tendencies of WPE and individual factors in Liaoning Province from 2006 to 2016
The WPE in Liaoning Province showed a steady upward trend from 2006 to 2016 with an average annual growth rate of 24.2%. The resource effect was positive throughout the ten year period, and this enhanced the ecological well-being level. The economic effect and the well-being effect were negative, and this constrained the ecological well-being level (Fig. 4). In this period, the improvement of ecological well-being level in Liaoning Province relied mainly on the excessive consumption of ecological resources, and high consumption and low output were the main problems facing economic growth. These problems resulted in environmental pollution, wasted resources and other problems that to a certain extent limited the growth of the well-being level effect. After 2012, the situation in Liaoning Province has improved, with the pulling effect of the resource effect weakening year by year. The consumption of ecological resources has become more efficient, and economic growth has gradually become less dependent on the excessive consumption of ecological resources and has begun to change to a high-efficiency, intensive economic model. Although the economic effect was still an inhibiting factor, the degree of inhibition had begun to weaken significantly. In addition, the inhibition from the well-being effect increased slightly, and to a certain extent this affected the improvement of the WPE. This suggests that a series of social problems that have emerged as a result of the economic growth of Liaoning Province have not been effectively dealt with. These problems are key factors affecting the improvement of the province’s ecological well-being level at present.

3.3 Analysis of sustainable economic development from the perspective of ecological well-being

Taking the years 2006 and 2007 as the base period, the trend of sustainable economic development in Liaoning Province has shown an inferior-medium-advanced sustainable development trend (Fig. 5).
Fig. 5 Changes in sustainable economic development trends in Liaoning Province from 2006 to 2016 (Trend types presented in Table 2)
The level of human well-being and the consumption of ecological resources both increased in 2008, 2009 and 2010, but the rate of improvement of ecological well-being performance did not exceed that of the base period, which means that the efficiency of well-being output in terms of the cost of resource consumption was low and the sustainable development trend was poor. The efficiency of well-being output in 2011 and 2012 gradually improved, and the rate of improvement of ecological well-being performance accelerated and exceeded that of the base period. However, the improvement of well-being level came mainly as a result greater consumption of ecological resources. If the natural resources had been rationally utilize and protected, the economy would change into sustainable development. As the concepts of environmental protection were internalized and policies to protect the environment were implemented, the direction of economic development in Liaoning Province improved over time and a high sustainable development trend was realized in 2013 and 2014. The level of social well-being has steadily improved, and the consumption of ecological resources has also been brought under control. The coordinated development of ecology-environment-society has gotten more attention. Although the consumption of ecological resources in Liaoning Province increased in 2015, ecological well-being performance has continued to improve as compared to the base period. Due to the GDP of Liaoning Province in 2016 is negative growth compare with the previous year, added by, the primary and secondary industries were decreased, the trend of sustainable economic development was not present.

4 Conclusions and discussion

4.1 Conclusions

During the period from 2006 to 2016, the level of human development in Liaoning Province rose steadily, while ecological well-being performance first decreased first and then rose; the main factor influencing these developments was change to the ecological footprint. Before 2010, a development model depending on the high-consumption of ecological resources caused ecological well-being performance to decline year by year. Beginning in 2010, a new approach to industrialization based on a steady reduction in the consumption of ecological resources gradually took root and the ecological well-being performance of Liaoning Province improved.
The ecological well-being performance showed a U-shaped relationship with economic development in Liaoning Province. In 2010, ecological well-being performance was its lowest; after that, the new economic development model led to reduced consumption of resources and an improved environment. The growth of the ecological well-being performance was mainly driven by the consumption of resources, and the efficiency of economic output began to increase after 2012. The pulling effect of resources consumption became obviously weaker. The economic transformed extensive growth to intensive growth. The overall trend of sustainable economic development generally moved from “inferior” to “medium” to “advanced”. However, the consumption of resources increased slightly in 2015, and the value of secondary industries decreased in 2016, resulting in a slight decline in the trend of sustainable economic development.

4.2 Discussion

Liaoning Province is located in a coastal area, and its ecological resources and economic development have much in common with other coastal provinces in China. This study calculated the human development index and ecological footprint of all coastal provinces in 2016 and compared them with Liaoning Province. “The Vitality of the Earth Report 2016” released by the World Wide Fund for Nature (WWF) pointed out that the global biological carrying capacity per capita in 2016 was 1.7 global hectares. The Human Development Report 2016 issued by UNDP stated that the average human development index for China was 0.8. Based on this standard, the eleven coastal provinces in China were divided into four types: high-consumption and high-welfare, high-consumption and low-welfare, low- consumption and low-welfare, and low-consumption and high-welfare (Fig. 6).
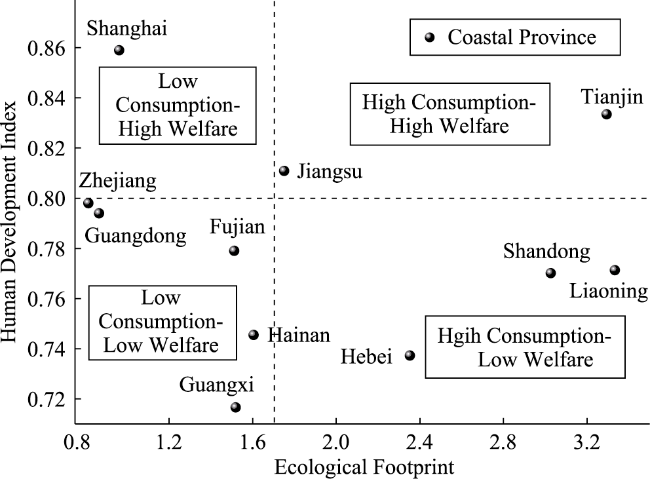
Fig. 6 Current situation of EP in China’s coastal provinces in 2016
Among the coastal, Liaoning Province, Shandong Province and Hebei Province were high-consumption and low- welfare provinces. Their ecological footprints were far higher than 1.7, but their human development indexes had not yet reached the national average level, and their levels of ecological well-being performance were relatively low. Tianjin and Jiangsu Province were high-consumption and high-welfare provinces. Guangdong Province, Zhejiang Province, Fujian Province, Guangxi Province and Hainan Province were low-consumption and low-welfare provinces. Jiangsu Province and Zhejiang Province have better development potential because of their proximity to Shanghai, and they are gradually becoming low-consumption and high-welfare areas. Shanghai has the highest human development index at 0.86 and an ecological footprint of only 0.96. Its development model is the closest to ideal in China and realizing the same model is the goal of sustainable development in other coastal provinces.
Liaoning Province has a high ecological footprint and its human development welfare has not yet reached the national average. This is related to the development history of its industry. Traditional heavy industries have always occupied a large proportion in the province’s industrial structure. A series of historical problems such as predatory mining of mineral resources and unreasonable utilization of natural resources have seriously affected the improvement of its ecological well-being level. The establishment of an intensive, ecological production model is the only way to achieve sustainable economic development in Liaoning Province.

The authors have declared that no competing interests exist.

[1]
Ang B W.2004. Decomposition analysis for policymaking in energy: Which is the preferred method?Energy Policy, 32(9): 1131-1139.

[2]
Ang B W.2005.The LMDI approach to decomposition analysis: A practical guide.Energy Policy, 33(7): 867-871.

[3]
Chen Xin.2012. Research on economic sustainable development from the perspective of ecological welfare. Shaanxi Normal University. (in Chinese)

[4]
Daly H E.1974. The world dynamics of economic growth: The economics of the steady state.American Economic Review, 64(2): 15-23.

[5]
Daly H E.2005. Economics in a full world.Scientific American, 293(3): 100-107.

[6]
Deng He, Jiang Shanqiu.2014. Preliminary research on ecological welfare system. Journal of Chongqing University (Social Science Edition), 20(1): 126-130. (in Chinese)

[7]
Dietz T, Rosa E, York R.2009. Environmentally efficient well-being: Rethinking sustainability as the relationship between human well-being and environmental impacts. Human Ecology Review, 16(1): 114-123.

[8]
Fan Shengyue, Ma Liangliang.2016. Environmental Kuznets Curve analysis of the footprints family in mainland China.Journal of Natural Resources, 31(9): 1452-1462. (in Chinese)

[9]
Fan Yali.2009. Introduction of ecological welfare and socialization — in the perspective of social policy.Hebei Academic Journal, 29(6): 132-135. (in Chinese)

[10]
Feng Jifang, Yuan Jianhong.2016. Ecological welfare performance — a new analysis tool for sustainable development.Science and Technology Management Research, 36(12): 240-244. (in Chinese)

[11]
Fu Wei, Zhao Junquan, Du Guozhen.2014. The evaluation of resources sustainable utilization — based on empirical analysis of resources welfare index.Journal of Natural Resources, 29(11): 1902-1915. (in Chinese)

[12]
He Lin, Chen Xin.2011. Research on sustainable development of Shaanxi Province based on ecological welfare.Research on Development, (6): 24-28. (in Chinese)

[13]
Huang Baorong, Cui Shuhong, Li Yingming.2016. Ecological footprint evolution characteristics and its influencing factors in China from 2000 to 2010.Environmental Science, 37(2): 420-426. (in Chinese)

[14]
Jorgenson A K.2014. Economic development and the carbon intensity of human well-being.Nature Climate Change, 4(3): 186-189.

[15]
Knight K.2014.Temporal variation of the relationship between environmental demands and well-being: A panel analysis of developed and less-developed countries.Population & Environment, 36(1): 32-47.

[16]
Knight K, Rosa E.2011. The environmental efficiency of well-being: A cross-national analysis.Social Science Research, 40(3): 931-949.

[17]
Li Jing, Liu Lingling.2017. Spatial pattern and spatial differentiation of China’s regional human development.Economic Geography, 37(5): 42-50. (in Chinese)

[18]
Liu Moucheng, Li Wenhua.2009. The calculation of China's equivalence factor under ecological footprint mode based on net primary production.Journal of Natural Resources, 24(9): 1550-1559. (in Chinese)

[19]
Liu Qian, Huang Xisheng.2013. Discussions of ecological welfare system in China.Journal of Hebei University (Philosophy and Social Science), 38(6): 147-151. (in Chinese)

[20]
Long Liangjun, Wang Xia, Guo Bing.2016. Evaluation on sustainable urban development from the perspective of ecological well-being performance — a case study of Shanghai.Resources and Environment in the Yangtze Basin, 25(1): 9-15. (in Chinese)

[21]
Lu Lina, Ge Chazhong, Lin Aijun et al.2016. Research on sustainable development of Lichuan City in Hubei Province based on ecological footprint and ecological carrying capacity. China Population, Resources and Environment, (S2): 124-129. (in Chinese)

[22]
Qi Peng, Xu Yudong, Deng Lina.2017. A review of ecological well-being performance study at home and abroad.Journal of Shenyang University of Technology(Social Science Edition), 10(6): 521-526. (in Chinese)

[23]
Rice J.2008. Material consumption and social well-being within the periphery of the world economy: an ecological analysis of maternal mortality.Social Science Research, 37(4): 1292-1309.

[24]
Robert M S.2008. The economics of resources or the resources of economics.Journal of Natural Resources Policy Research, 1(1):69-82.

[25]
Veenhoven R.2002. Why social policy needs subjective indicators.Social Indicators Research, 58(1): 33-45.

[26]
William E R.1992. Ecological footprints and appropriated carrying capacity: What urban economics leaves out.Environment and Urbanization, 4(2): 121-133.

[27]
Yew K.2008. Environmentally responsible happy nation index: Towards an internationally acceptable national success indicator.Social Indicators Research, 85(4): 425-446.

[28]
Zang Mandan, Zhu Dajian, Liu Guoping.2013. Ecological well-being performance: Concept,connotation and empirical of G20.China Population, Resources and Environment, 23(5): 118-124. (in Chinese)

[29]
Zhang Shuai, Shi Qinghua.2017. Conducting the research on sustainable development through the use of human development index and ecological footprint: Based on the paradigm of strong sustainability.Journal of Shanghai Jiao Tong University(Philosophy and Social Sciences), 25(3): 99-108. (in Chinese)

[30]
Zhang Yingqin, Wei Shuang.2016. A comparative study on interregional of China on the ecological well-being performance and sustainable development.Journal of Xi’an University of Finance and Economics, 29(6): 22-29. (in Chinese)

[31]
Zhu Dajian, Zhang Shuai.2014a. The research on wellbeing level of China and its impact factors from the perspective of ecological footprint.Urban and Environmental Studies, 1(1): 18-33. (in Chinese)

[32]
Zhu Dajian, Zhang Shuai.2014b. Resource on ecological wellbeing performance and its relationship with economic growth. China, Population, Resources and Environment, 24(9): 59-62. (in Chinese)

[33]
Zhu Dajian, Zhang Shuai.2014c. Ecological well-being performance and further research on sustainable development.Journal of Tongji University(Social Science Section), 25(5): 106-115. (in Chinese)

Outlines

/