
Journal of Resources and Ecology >
Quantifying the Degree of Water Resource Utilization Polarization: A Case Study of the Yellow River Basin
Received date: 2018-03-28
Accepted date: 2018-07-10
Online published: 2019-01-28
Supported by
National Natural Science Foundation of China (41371486).
Copyright
The overexploitation of water resources has a substantial influence on their sustainable utilization and the ecological environment in a river basin. Quantification of the development and utilization of water resources plays an important role in guiding the rational utilization of water resources. Based on this, this paper develops the concept of water resource utilization polarization (WRUP) in order to qualitatively analyze whether water resources are being overexploited in the process of utilization. An index model of WRUP was built to quantify the degree of water resources overexploitation. In addition, taking seven secondary basins of the Yellow River as examples, the available quantity, overdraft and polarization indexes of surface water and groundwater resources were calculated. The results show that there are 34.49×10⁸ m3 of surface water available, which accounts for 56.21% of the total surface water volume. A total of 5.84×10⁸ m3 of groundwater is available, which is 58.74% of the total groundwater resources. We also found that the water resources are heavily overexploited and that there is extensive polarization in the middle and lower reaches of the Yellow River. The highest polarization of water resources occurs from Lanzhou to Toudaoguai where the polarization index is 19.88 and from Longmen to Sanmenxia where it is 11.81. There is no polarization above Longyangxia or from Toudaoguai to Longmen. Overall, the polarization of water resources is 7.95 over the entire Yellow River area. These results provide a reference for the availability of water resources that can be used to determine the degree of overexploitation of the water resources in the Yellow River.
GU Shijie , LU Chunxia , QIU Jingen . Quantifying the Degree of Water Resource Utilization Polarization: A Case Study of the Yellow River Basin[J]. Journal of Resources and Ecology, 2019 , 10(1) : 21 -28 . DOI: 10.5814/j.issn.1674-764X.2019.01.003
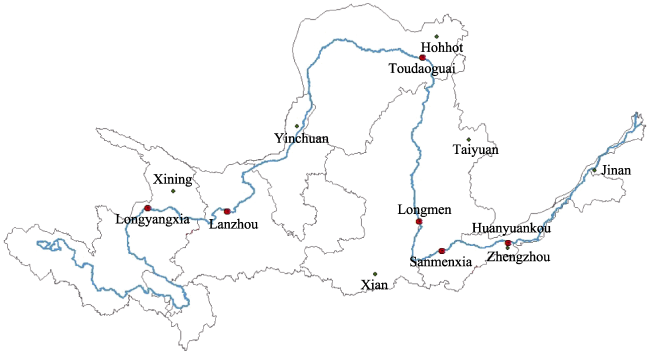
Fig. 1 The two-grade district division of the Yellow River |
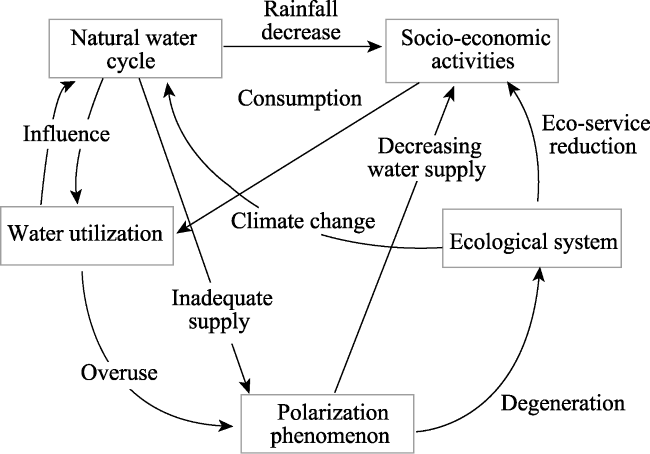
Fig. 2 Relationship of the polarization of water resource utilization |
Table 1 Available surface water and surface water yield in different reaches of the Yellow River (unit: 108 m3) |
| Control region | Above Lyx | Lyx-Lz | Lz-Tdg | Tdg-Lm | Lm-Smx | Smx-Hyk | Below Hyk |
|---|---|---|---|---|---|---|---|
| Amount of surface water | 270.92 | 157.16 | 7.25 | 20.04 | 88.98 | 58.91 | 10.33 |
| River water demand | 81.28 | 47.15 | 2.18 | 6.01 | 26.69 | 17.67 | 3.10 |
| Discarded water | 2.22 | 36.38 | 0 | 0 | 45.96 | 0 | 0 |
| Surface water availability | 187.43 | 73.63 | 5.08 | 14.03 | 16.33 | 41.24 | 7.23 |
| Surface water yield | 1.81 | 25.97 | 147.77 | 11.05 | 56.37 | 23.79 | 125.44 |
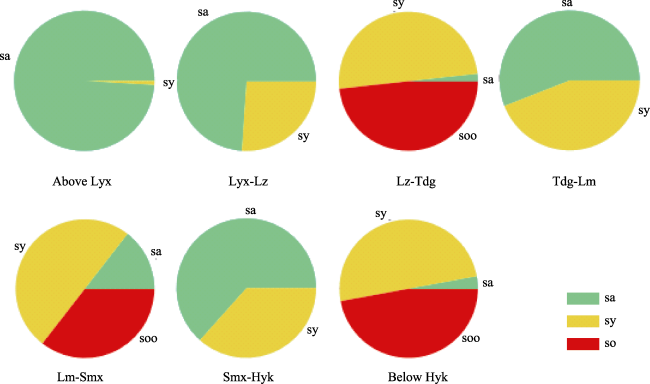
Fig. 3 Comparison chart of surface water available (sa), surface water yield (sy) and surface water overexploitation (so) in different reaches of the Yellow River |
Table 2 Available groundwater and groundwater yields in different reaches of the Yellow River (unit: 108 m3) |
| Control region | Above Lyx | Lyx-Lz | Lz-Tdg | Tdg-Lm | Lm-Smx | Smx-Hyk | Below Hyk |
|---|---|---|---|---|---|---|---|
| Water resources | 271.25 | 428.96 | 458.10 | 502.63 | 623.67 | 692.16 | 714.28 |
| Surface water resources | 270.92 | 428.08 | 435.33 | 455.37 | 544.35 | 603.26 | 613.59 |
| Groundwater accumulation | 19.30 | 7.06 | 20.76 | 35.94 | -47.24 | -12.17 | -13.52 |
| Groundwater yield | 0.07 | 4.15 | 30.23 | 8.12 | 50.38 | 16.60 | 17.44 |
| Groundwater available | 0.33 | 0.55 | 21.89 | 24.49 | 3.14 | 4.43 | 3.92 |
Table 3 Water resources polarization index in different reaches of the Yellow River |
| Control region | Above Lyx | Lyx-Lz | Lz-Tdg | Tdg-Lm | Lm-Smx | Smx-Hyk | Below Hyk |
|---|---|---|---|---|---|---|---|
| Control area (km2) | 121972 | 100579 | 145347 | 129654 | 190869 | 41615 | 21833 |
| WRUP | 0 | 6.55 | 19.88 | 0 | 10.78 | 2.75 | 11.81 |
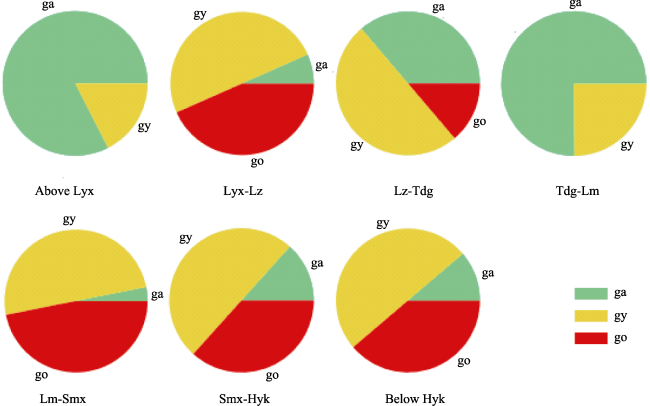
Fig. 4 Comparison chart of ground water available (ga), ground water yield (gy) and ground water overexploitation (go) in different reaches of the Yellow River |
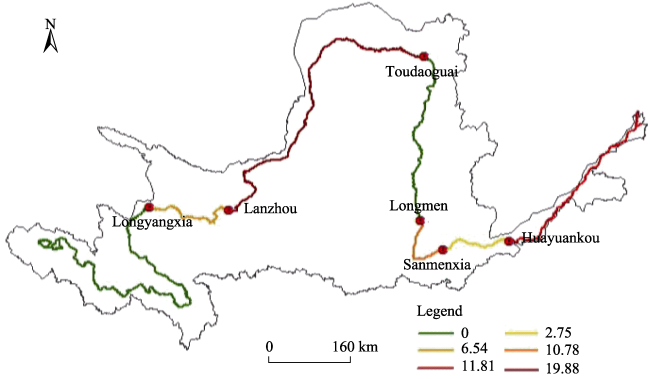
Fig. 5 Water resource polarization index in different reaches of the Yellow River |
The authors have declared that no competing interests exist.
| [1] |
|
| [2] |
Alley,
|
| [3] |
|
| [4] |
|
| [5] |
|
| [6] |
|
| [7] |
|
| [8] |
|
| [9] |
|
| [10] |
|
| [11] |
|
| [12] |
|
| [13] |
|
| [14] |
|
| [15] |
|
| [16] |
|
| [17] |
|
| [18] |
|
| [19] |
|
| [20] |
Sophocleous, M. (2000) From safe yield to sustainable development of water resources: the Kansas experience.Journal ofHydrology. 235: 27-43.
|
| [21] |
|
| [22] |
Wolfson, Michael.1994. When Inequalities Diverge. American Economic Review, 84(2): 353-358.
|
| [23] |
|
| [24] |
|
| [25] |
|
| [26] |
|
| [27] |
|
| [28] |
|
/
| 〈 |
|
〉 |