
Journal of Resources and Ecology >
The Conceptual Model and Its Empirical Studies of Sustainable Carrying Capacity of Water Resources:A Case Study of China Mainland
Received date: 2018-01-18
Accepted date: 2018-06-13
Online published: 2019-01-28
Supported by
National Social Science Foundation of China (17BJL105).
Copyright
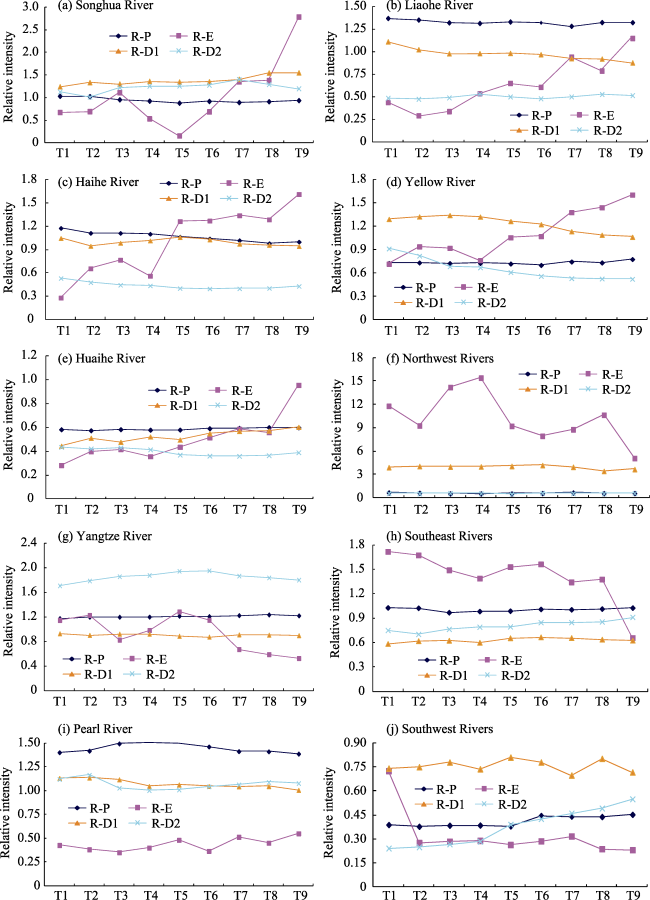
Based on the interactive development of new industrialization, rapid urbanization and agricultural modernization (IUAM), and from the viewpoint of interactive responses and supply-demand relationships between regional water resources carrying capacity and economic-social development, this paper puts forward the concepts and characterization methods of water resources relative intensity (WRI), water resources carrying rate (WCR) and sustainable index of water resources system (WSI). Considering the catastrophic trait of water resources carrying capacity and its contradictory relationship with WRI, a modified Catastrophe Model, which combines Catastrophe Theory and Fuzzy Mathematic Theory, was introduced to perform a multi-objective and multi-criterion comprehensive assessment of the sustainability of water resources carrying capacity (WSCC) based on benchmarking. According to these concepts and models, land WSCC for the China mainland was set as an example for empirical analysis. The results showed that at the scale of first-grade water regions, Liaohe River, Yangtze River and Pearl River regions had high WRI of domestic water, while Northwestern Rivers, Southeastern Rivers regions and Yangtze River region in some years had high WRI of eco-environment water. However, they were all in a downtrend, while the other four northern regions had low WRI in an uptrend. The agricultural WRI in Songhua River, Yellow River and Northwestern Rivers regions were relatively high and industrial WRI in Songhua River, Yangtze River and Pearl River regions were also relatively high. At the provincial scale, WSCC of urban domestic water was relatively stable, WSCC of eco-environment was obviously fluctuating, and WSCC of agriculture and industry were constantly rising. Overall, WRI in the China mainland generally decreased. The convergence of provinces with high consumption intensity of water resources and spatial spillover of WUE in high WCR provinces promotes water resources development and utilization, progressing toward doubly sustainable development. In the future, China should try to find new ideas and methods of dynamic management of regional water resources and unified management of basin water resources, building on the foundation of traditional water resources planning. Meanwhile, water resources should be considered in regional PRED (population, resources, ecology and development) systems for integrated dispatching and optimizing configuration so that the improvements of WSCC and harmonious development of water resources and regional populations, eco-environment, economy and society can be achieved.
ZANG Zheng . The Conceptual Model and Its Empirical Studies of Sustainable Carrying Capacity of Water Resources:A Case Study of China Mainland[J]. Journal of Resources and Ecology, 2019 , 10(1) : 9 -20 . DOI: 10.5814/j.issn.1674-764X.2019.01.002
Table 1 Contradictory scenario of regional water resource supply and demand in the context of IUAM interactive development |
| Background of regional development | Regulatory and control criteria and measures of water resources | Water resources (system) response | Impact on development of human living, eco-environment and production |
|---|---|---|---|
| Increasing population | R increases, RE and RD kept invariable, RP increases | Change of CRP is fuzzy and uncertain | Change of LSP is fuzzy and uncertain |
| R kept invariable, RE or RD decreases, RP increases | CRE or CRD mutates: overload | LSE or LSD declines, economic efficiency or environment quality declines | |
| R kept invariable, RP and RE kept invariable, RD kept invariable too | CRP mutates: overload | LSP decreases, Living standard declines | |
| …… | …… | …… | …… |
| IUAM interactive development | Unified management with multi-objective; joint control of amount and intensity | Dynamic balance | Coordinated development among human living, eco-environment and production |
Note: superscripts P, E, D stand for the 3 water resource subsystems of the regional PRED system, corresponding to water sectors of human living, eco-environment and production, respectively. |
Table 2 Assessment standard of development stage and warning states of regional water resources system |
| Sustainable index | Sustainable stage | Sustainable stage and explanation of system state | Warning grade |
|---|---|---|---|
| SI≥CV4 | Non-sustainable development | Amount of water resources development and utilization exceeds the standard, system state is critically dangerous | Red |
| CV4>SI≥CV3 | Pseudo-sustainable development | Water amount shows contradiction among each sector, system state is dangerous | Orange |
| CV3>SI≥CV2 | Quasi-sustainable development | At the cost of declining water demands, system state is critically safe | Yellow |
| CV2>SI≥CV1 | Weak-sustainable development | Water demands are satisfied, system state is relatively safe | Blue |
| CV1>SI | Strong-sustainable development | Water demands are satisfied, system state is safe | Green |
Note: CV1, CV2, CV3 and CV4 are the Critical values. |
Table 3 Assessment indicator system of WSCC and corresponding formulas of catastrophe models |
| Target layer | Sustainable carrying rate of water resources system | |||||
|---|---|---|---|---|---|---|
| Criterion layer | Domestic water | Eco-environmental water | Production water | |||
| Indicator layer | Urban domestic water | Rural domestic water | Water for urban green land | Agricultural water | Industrial water | Service industrial water |
| Number of control variables | 2 | 1 | 3 | |||
| types | The fold | The cusp | The swallowtail | |||
| Potential functions | f(x) = x4 + ax2 + bx | f(x) = x3 + ax | f(x) = x5 + ax3 + bx2 + cx | |||
| Equation of bifurcation set | a = ‒6x2 , b = 8x3 | a = ‒6x2 | a = ‒6x2, b = 8x3, c = ‒3x4 | |||
| Normalization formulas | xa = a1/2, xb = b1/3 | xa = a1/2 | xa = a1/2, xb = b1/3, xc = c1/4 | |||
Note: f(x) is the potential function of the system, that is f(SI); x is the state variable, that is SI; a、b、c are control variables, they represent domestic water, production water and eco-environmental water, respectively; xa-xc are catastrophe progressions ranging from 0 to 1. |
Fig. 1 Comparison of water resources relative intensity for first-grade water resource regions in China mainland |
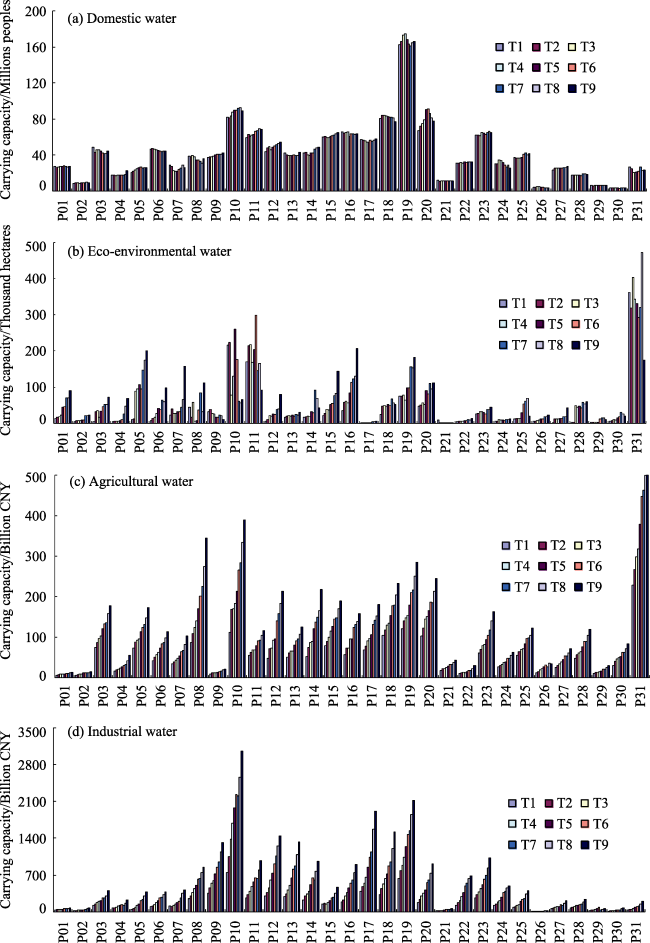
Fig. 2 Changing trends of WSCC for Provinces in China mainland |
Table 4 Comprehensive assessment results of water resources for the China mainland |
| WSI | Sustainable stage | Warning grade | Initial stage | Last stage |
|---|---|---|---|---|
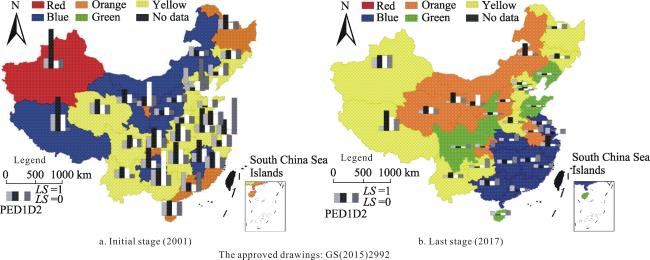
| SI≥0.8331 | Non-sustainable development | Red | Xinjiang | None |
| 0.8331>SI≥0.7915 | Pseudo-sustainable development | Orange | Heilongjiang, Ningxia, Chongqing, Fujian, Shanghai, Guangdong, Hainan | Inner Mongolia, Shanxi, Ningxia, Gansu, Qinghai, Chongqing, Anhui |
| 0.7915>SI≥0.7367 | Quasi-sustainable development | Yellow | Jilin, Liaoning, Hebei, Beijing, Tianjing, Shandong, Henan, Jiangsu, Zhejiang, Anhui, Hubei, Hunan, Guangxi, Yunnan, Sichuan | Heilongjiang, Jilin, Hebei, Henan, Xinjiang, Tibet, Yunnan, Guizhou |
| 0.7367>SI≥0.6528 | Weak-sustainable development | Blue | Inner Mongolia, Gansu, Tibet, Shanxi, Shaanxi, Guizhou, Jiangxi | Hubei, Hunan, Jiangxi, Jiangsu, Shanghai, Zhejiang, Fujian, Guangdong, Guangxi |
| 0.6528>SI | Strong-sustainable development | Green | None | Liaoning, Beijing, Tianjing, Shandong, Shaanxi, Sichuan, Hainan |
Fig. 3 Grade distribution of comprehensive evaluation of water resources system for the China mainland |
The authors have declared that no competing interests exist.
| [1] |
|
| [2] |
|
| [3] |
|
| [4] |
|
| [5] |
|
| [6] |
|
| [7] |
|
| [8] |
|
| [9] |
|
| [10] |
|
| [11] |
|
| [12] |
|
| [13] |
|
| [14] |
|
| [15] |
|
| [16] |
|
| [17] |
|
| [18] |
|
| [19] |
|
| [20] |
|
| [21] |
|
| [22] |
|
| [23] |
|
| [24] |
UNESCO/FAO. l 985.Carrying capacity assessment with a pilot study of Kenya: a resource accounting methodology for sustainable development. Paris and Rome.
|
| [25] |
|
| [26] |
|
| [27] |
|
| [28] |
|
| [29] |
|
| [30] |
|
| [31] |
|
| [32] |
|
| [33] |
|
| [34] |
|
| [35] |
|
| [36] |
|
| [37] |
|
| [38] |
|
| [39] |
|
| [40] |
|
/
| 〈 |
|
〉 |