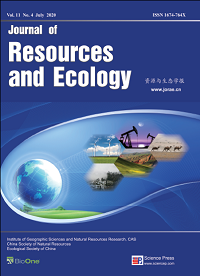
A comparative discussion of the advantages and disadvantages of natural stands and plantations, including in terms of their productivity and stability, began from the moment of the first forest plantings and continues to this day. In the context of the progressive replacement of natural forests by plantations due to deforestation, the question of how will change the carbon storage capacity of forest cover when replacing natural forests with artificial ones in a changing climate becomes extremely relevant. This article presents the first attempt to answer this question at the transcontinental level on a special case for two-needled pine trees (subgenus Pinus L.). The research was carried out using the database compiled by the authors on the single-tree biomass structure of forest-forming species of Eurasia, in particular, data of 1880 and 1967 of natural and plantation trees, respectively. Multi-factor regression models are calculated after combining the matrix of initial data on the structure of tree biomass with the mean January temperature and mean annual precipitation, and their adequacy indices allow us to consider them reproducible. It is found that the aboveground and stem biomass of equal-sized and equal-aged natural and plantation trees increases as the January temperature and precipitation rise. This pattern is only partially valid for the branches biomass, and it has a specific character for the foliage one. The biomass of all components of plantation trees is higher than that of natural trees, but the percent of this excess varies among different components and depends on the level of January temperatures, but does not depend at all on the level of annual precipitation. A number of uncertainties that arose during the modeling process, as well as the preliminary nature of the obtained regularities, are noted.
Himalayan region represents the highest and most diverse treeline over the world. As one of the most conspicuous boundaries between montane forests and alpine vegetation, the alpine timberline attracted the interest of researchers for many decades. However, timberline in the Himalayas is understudied compared with European counterparts due to remoteness. Here we review the distribution pattern of timberline and its climatic condition, the carbon and nutrient supply mechanism for treeline formation, and treeline shift and treeline tree recruitment under climate change scenarios. Growth limitation, rather than carbon source limitation is the physiological cause of timberline under the low temperature condition. Nutrient limitation and water stress are not the direct cause of timberline formation. However, more clear local limitation factors are need to integrate in order to enable us to predict the potential impacts and changes caused by human activity and related global change in this sensitive region.
Pinus taiwanensis is a species endemic to China. This study selected four typical plots of Pinus taiwanensis in the natural secondary forest around Macheng City, in order to reveal the characteristics of and the relationships between different diameter classes (determined based on the diameter at breast height or DBH), forest densities and species diversity, as well as the similarities of species diversity of different plots within the community. The result showed that Pinus taiwanensis was the dominant species in the community. The ratio of Pinus taiwanensis trees of diameter class IV reached a peak of 19.46% of the total followed by diameter class VII at 18.92%. The study recorded 156 species of vascular plants from 130 genera of 71 families; Pinus taiwanensis was the dominant species in the community. When the forest density was 1200 trees ha -1 with the largest average diameter of DBH=36.779±4.444 cm, the diversity (Shannon index H'=1.6716) and the evenness (Pielou index E=0.6727) of the tree layer was the highest. When the forest density reached 1525 trees ha -1 with the lowest average diameter of DBH=18.957±5.141 cm, the richness (Dma=5.4308), the diversity (H'=2.9612) and the evenness (E=0.8985) of all shrub layers climbed to the maximum. When the forest density was 1325 trees ha -1, the richness (Dma=5.8132), the diversity (H'=3.0697) and the evenness (E=0.9025) of all herb layers peaked. In terms of vertical structure, the average diversity indexes were herb layer>shrub layer>tree layer. High canopy density weakened light intensity in the community, causing a reduction in the species diversities of herbs and shrubs. The average similarity coefficient between the sample plots was 0.3356, which was at the medium dissimilarity level. External disturbances and improper management were major contributors to the low species diversity of the community. The implementation of scientific management measures is urgently needed to optimize the forest structures of Pinus taiwanensis, create a benign community environment, and promote species diversities and establish a stable forest community structure.
Grain production patterns are the basis of a nation’s food security. Since China’s reform and opening-up began in 1978, China’s urbanization process, driven by rapid social and economic development, has accelerated steadily. During this time, the dietary structure of urban and rural Chinese has also changed significantly. Accordingly, grain production patterns have undergone major changes. First, traditional grain production patterns in the north and the south have changed, and the food production center has shifted toward the north. In 1980, the grain yield of southern provinces accounted for 60% of China’s total, while that of northern provinces accounted for 40%. In 2015, the grain yield of southern provinces accounted for 56% of the total, while that of northern provinces accounted for 44%. Second, grain production by regions of the country is “shrinking in the east but expanding in the central regions,” meaning that grain production in eastern coastal provinces has decreased significantly, while that in the central region has expanded. The proportions of the nation’s total grain production from the eastern, central and western regions were 38%, 36% and 26%, respectively, in 1980. These had changed to 27%, 46%, and 27%, respectively, in 2015. Third, the spatial centralization of grain production has increased. The total grain yield of 13 major grain-producing provinces and regions in the country accounted for 69.27% of nation’s total in 1980, and it had reached 76.18% in 2015, showing that the impact of major grain-producing areas on national food security has increased. The influence of rapid urbanization on grain production areas shows remarkable regional differences. As the level of urbanization has increased, build-up land occupies a large number of high-quality farmland, especially in east coastal provinces and thus the grain planting area decreased obviously. The effect of dietary structure changes on grain production patterns was evident in two ways. On the one hand, as dietary diversity has increased, total grain consumption has decreased. The reduction in the proportion of planting area for grain crops to total crop planting area dropped from 82% in 1980 to 68% in 2015, making this change in total grain consumption evident. On the other hand, the ratio of grain for human consumption declined as the ratio of grain consumed by animals increased. The reduction in the proportion of rice and wheat grown and an increase in the proportion of feed grain production (mostly maize) from 20% in the 1980s to 36% in 2015 makes this change in grain production and consumption evident. In the future, with the establishment of national functional areas for grain production, the spatial pattern of grain production will return, while the demand for feed grains will continue to increase but with the space for expansion limited.
The identification of poverty at the county level is the precondition for poverty alleviation by formulating accurate strategies that are targeted for a certain area. Yunnan Province has the largest number of poverty counties in China. The vast number of people living under the poverty-line, and the deep degree of poverty across a wide distribution range, pose major challenges. Based on the rural poverty incidence data, this paper describes the rural poverty patterns in Yunnan Province in 2010 and 2015, and then it explores the main factors which influence the incidence and changes in rural poverty at the county level in Yunnan Province using a stepwise regression analysis method. This study found that the rural poverty in counties of Yunnan Province was deeply affected by natural conditions and the geographical environment. In 2010 and 2015, the rural poverty situation in the middle region of Yunnan Province was relatively light, while it was more serious in the northwest, northeast and south regions. The pattern of county poverty is in good agreement with the topography and landforms of Yunnan Province and the poverty-stricken areas. There are strong correlations between the incidence of rural poverty in Yunnan Province with both the annual per capita net income of rural residents and the degree of agricultural mechanization. These factors are related to the living standards and agricultural production necessary for the peasantry to sustain their livelihood. The change in the incidence of rural poverty at the county level in Yunnan Province from 2010 to 2015 is significantly correlated with changes in the value-added of the primary industries and the degree of agricultural mechanization. These correlations indicate that the development of primary industry plays a key role in the process of lifting rural residents in Yunnan Province out of poverty so they can achieve prosperity. Therefore, improving the annual per capita net income of rural residents and the degree of agricultural mechanization for rural areas in Yunnan Province are still the main points for focused efforts. In the current phase of poverty alleviation, Yunnan Province should emphasize increasing rural residents' income and agricultural production and management in order to formulate effective policies and measures for poverty alleviation.
Currently, the reduction of weight in automotive is a very important topic to reduce the air pollution. In this context, the purpose of the present paper is to analyze a real case study through a comparison of the environmental impacts between a conventional steel bumper and a polyester prototype. In the first part of this work, a door-to-door life-cycle assessment methodology was used throughout the study of the component manufacturing phase. The SimaPro 7.1 software is used to evaluate the impacts of both bumpers on the environment and health. The second part is devoted to dust analysis from the polyester workshop. The obtained results have allowed us to show the company that its choice of steel substitution by the polyester is advantageous for certain impacts including the impact of climate change, but unfortunately there may be, given the working conditions of the polyester workshop, a transfer of impact, since we will end up with a risk of health (irritations, cancers) for the workers. LCA has proven to be a very useful tool for validating a redesigned automotive component from an environmental point of view; from this case study, several recommendations were made for the company to design environmentally friendly components, and ecodesign should be introduced into the company’s procedures.
In order to control the air pollution caused by ships and improve ambient air quality, China set up three domestic emission control areas (DECAs) in 2015 in the Pearl River Delta, the Yangtze River Delta and Bohai Rim (Beijing-Tianjin-Hebei) waters. In order to meet the emission requirements established at the 70th meeting of the Marine Environmental Protection Committee (MEPC), China intends to apply for the establishment of three international Emission Control Area (ECA) in 2030 for these DECAs. This paper discusses existing technologies to reduce emissions of nitrogen oxides (NOx) and sulphur oxides (SOx), and examines the abatement costs for the shipping industry in the year 2030 to comply with this action. Based on an examination of the literature and data collected for this study, four traditional alternatives, low-sulphur fuel, sulphur scrubbers/exhaust gas cleaning systems (EGCS), selective catalytic reduction (SCR), and exhaust gas recirculation, are analyzed. The analysis finds that switching to low-sulphur fuel is the best technical solution for SOx emission reduction, and the installation of SCR is the best technology for reducing nitrogen. In addition to traditional emission reduction technologies, the use of shore power facilities and liquefied natural gas (LNG), two alternatives welcomed by China’s green shipping industry, are also considered in this paper. The expected average abatement cost of these alternatives in the year 2030 are USD 2.866 billion, 0.324 billion, 1.071 billion, 0.402 billion, 0.232 billion and 0.34 billion, respectively.
Uranium is the basic raw material for nuclear energy and is quite highly regarded. Developing a safe supply of uranium is important for safeguarding sustainable nuclear development. The purpose of this study is to evaluate the sustainability of uranium development in China based on dynamic system modeling combined with GAN (Generative Adversarial Network) analysis. We considered eight essential indicators and 42 sub-indicators as part of a detailed quantitative description, and then developed a framework to evaluate and rank China-specific sustainability in light of the quantitative performance of five options for fuel cycle transition scenarios. We began by using KMO sample measurements and the Bartlett Test of Sphericity to determine the suitability of factor analysis and the fitness of the corrected model map and observation data. We then analyzed the roles of different representatives of the decision makers and their impacts on the overall ranking by applying GAN methods from a weighted perspective. Five transition scenarios identified are 1) Pressurized Heavy Water Reactors, 2) Mixed Light Water Reactor + Fast Reactor, 3) Mixed LWR+FR fuel cycle scheme with heterogeneous irradiation, 4) Mixed Pressurized Water Reactor + FR fuel cycle scheme with plutonium recycled directly and repeatedly, and 5) Sodium-cooled fast breeder reactor power plant. The results showed that scenario 1 is the most unsustainable and highly confrontational scenario with a high demand for uranium resources, the lowest sustainability and a high level of antagonism among departments. On the other hand, Scenario 5 requires more advanced technology but exhibits less antagonism among the departments, and thus it largely satisfies the basic requirements for uranium sustainability and low levels of antagonism. In this paper, a safety assessment index system for the uranium supply is computed using a GAN framework. This system plays a crucial role in the sustainable supply and development of uranium, and provides flexibility for coping with the evolution and inherent uncertainties of the necessary technological developments.
Among water blooms, cyanobacteria bloom occurs over the widest range and is much more harmful than other blooms. Its occurrence in inland water bodies is affected by many factors, such as meteorology, hydrology, and human activities. Therefore, the study of the causes of cyanobacterial bloom has become a major focus of scholars. The China Knowledge Network Journal Database contains 143 papers from China and abroad from the years 2004 to 2019 that are relevant to the study of cyanobacteria bloom. We begin by analyzing keywords in these studies and creating a keyword distribution map which indicates the factors related to the blooms. Based on parameters such as the frequency of words appearing in the text, the full text of each of the 143 papers is analyzed to form a word cloud created by a program written in Python language. After irrelevant terms are eliminated, the word cloud map can reveal potential factors that were not identified by keywords alone. After completing this macro analysis, we examined approximately 100 related papers from the China Knowledge Network Journal Database and Web of Science Database published from 2014 to 2019. Finally, we summarize the main reasons for the outbreak of water blooms. The factors causing blooms can be divided into natural factors and human factors. Among the natural factors are illumination, water temperature and nutrient salt conditions. The human factors are generally related to large-scale water conservancy projects. This paper analyzes and summarizes these factors, and provides a reference to aid in the prevention and treatment of algal blooms. The information in the paper has a certain practical significance for the protection of water environments.
In the process of implementing the River Leader System, some problems have emerged regarding its progress and effects. From the perspective of historical institutionalism, the historical change process of the River Leader System was revealed in this paper. There were two key nodes in the historical change progress of the River Leader System. In 2014, the river leader system promotion was transferred from the local government to the Ministry of Water Resources. In 2016, the River Leader System was recognized by the central government and implemented nationwide. The historical change process of the River Leader System can be divided into three periods: the creation and formation period, the pilot and diffusion period, and the promotion and strengthening period. The change in the river and lake problems was an important driving force for the historical change of the River Leader System. A path dependent phenomenon was mainly reflected in the policy diffusion scope, problem orientation, main tasks and management methods. At present, there are some shortcomings in the River Leader System, such as a lack of inter-provincial coordination, imperfect evaluation mechanism, poorly coordinated management tasks, and insufficient public participation. To solve these problems, some policy recommendations are put forward. In the short term, the River Leader System will be continuously improved and strengthened. In the long term, it will be transformed into the integrated watershed management system.
Forest parks provide important recreational and tourism bene?ts to residents, so it is essential to know what residents’ perceptions are regarding the recreational value of forest parks for participatory forest planning and management. This study investigated forest park recreational value in the physical, psychological, and social dimensions in Shanghai according to questionnaires completed by 658 respondents, and examined the relationships between recreational value and residents’ social variables by multiple correspondence analysis (MCA). The results show the following: 1) The recreational value of forest parks is perceived as most important in the psychological dimension, while in the social dimension it is appreciated the least. 2) In terms of the differences in forest park recreational value in suburbs and rural areas, the social value in rural areas had significantly higher scores than in the suburbs, and the psychological value in suburbs is much higher than that in the rural areas. 3) Regarding the social variables which characterize residents in suburbs and rural areas, females and younger groups tended to assign higher scores to recreational value than males and older groups. Moreover, citizens with low education or low income also assigned higher scores to recreational value compared to more educated or higher-income residents. The results of this study reveal the recreational value characteristics of Shanghai forest parks in the three dimensions, which can provide a scientific basis for the sustainable development of urban forest resources and contribute to reasonable planning and management.